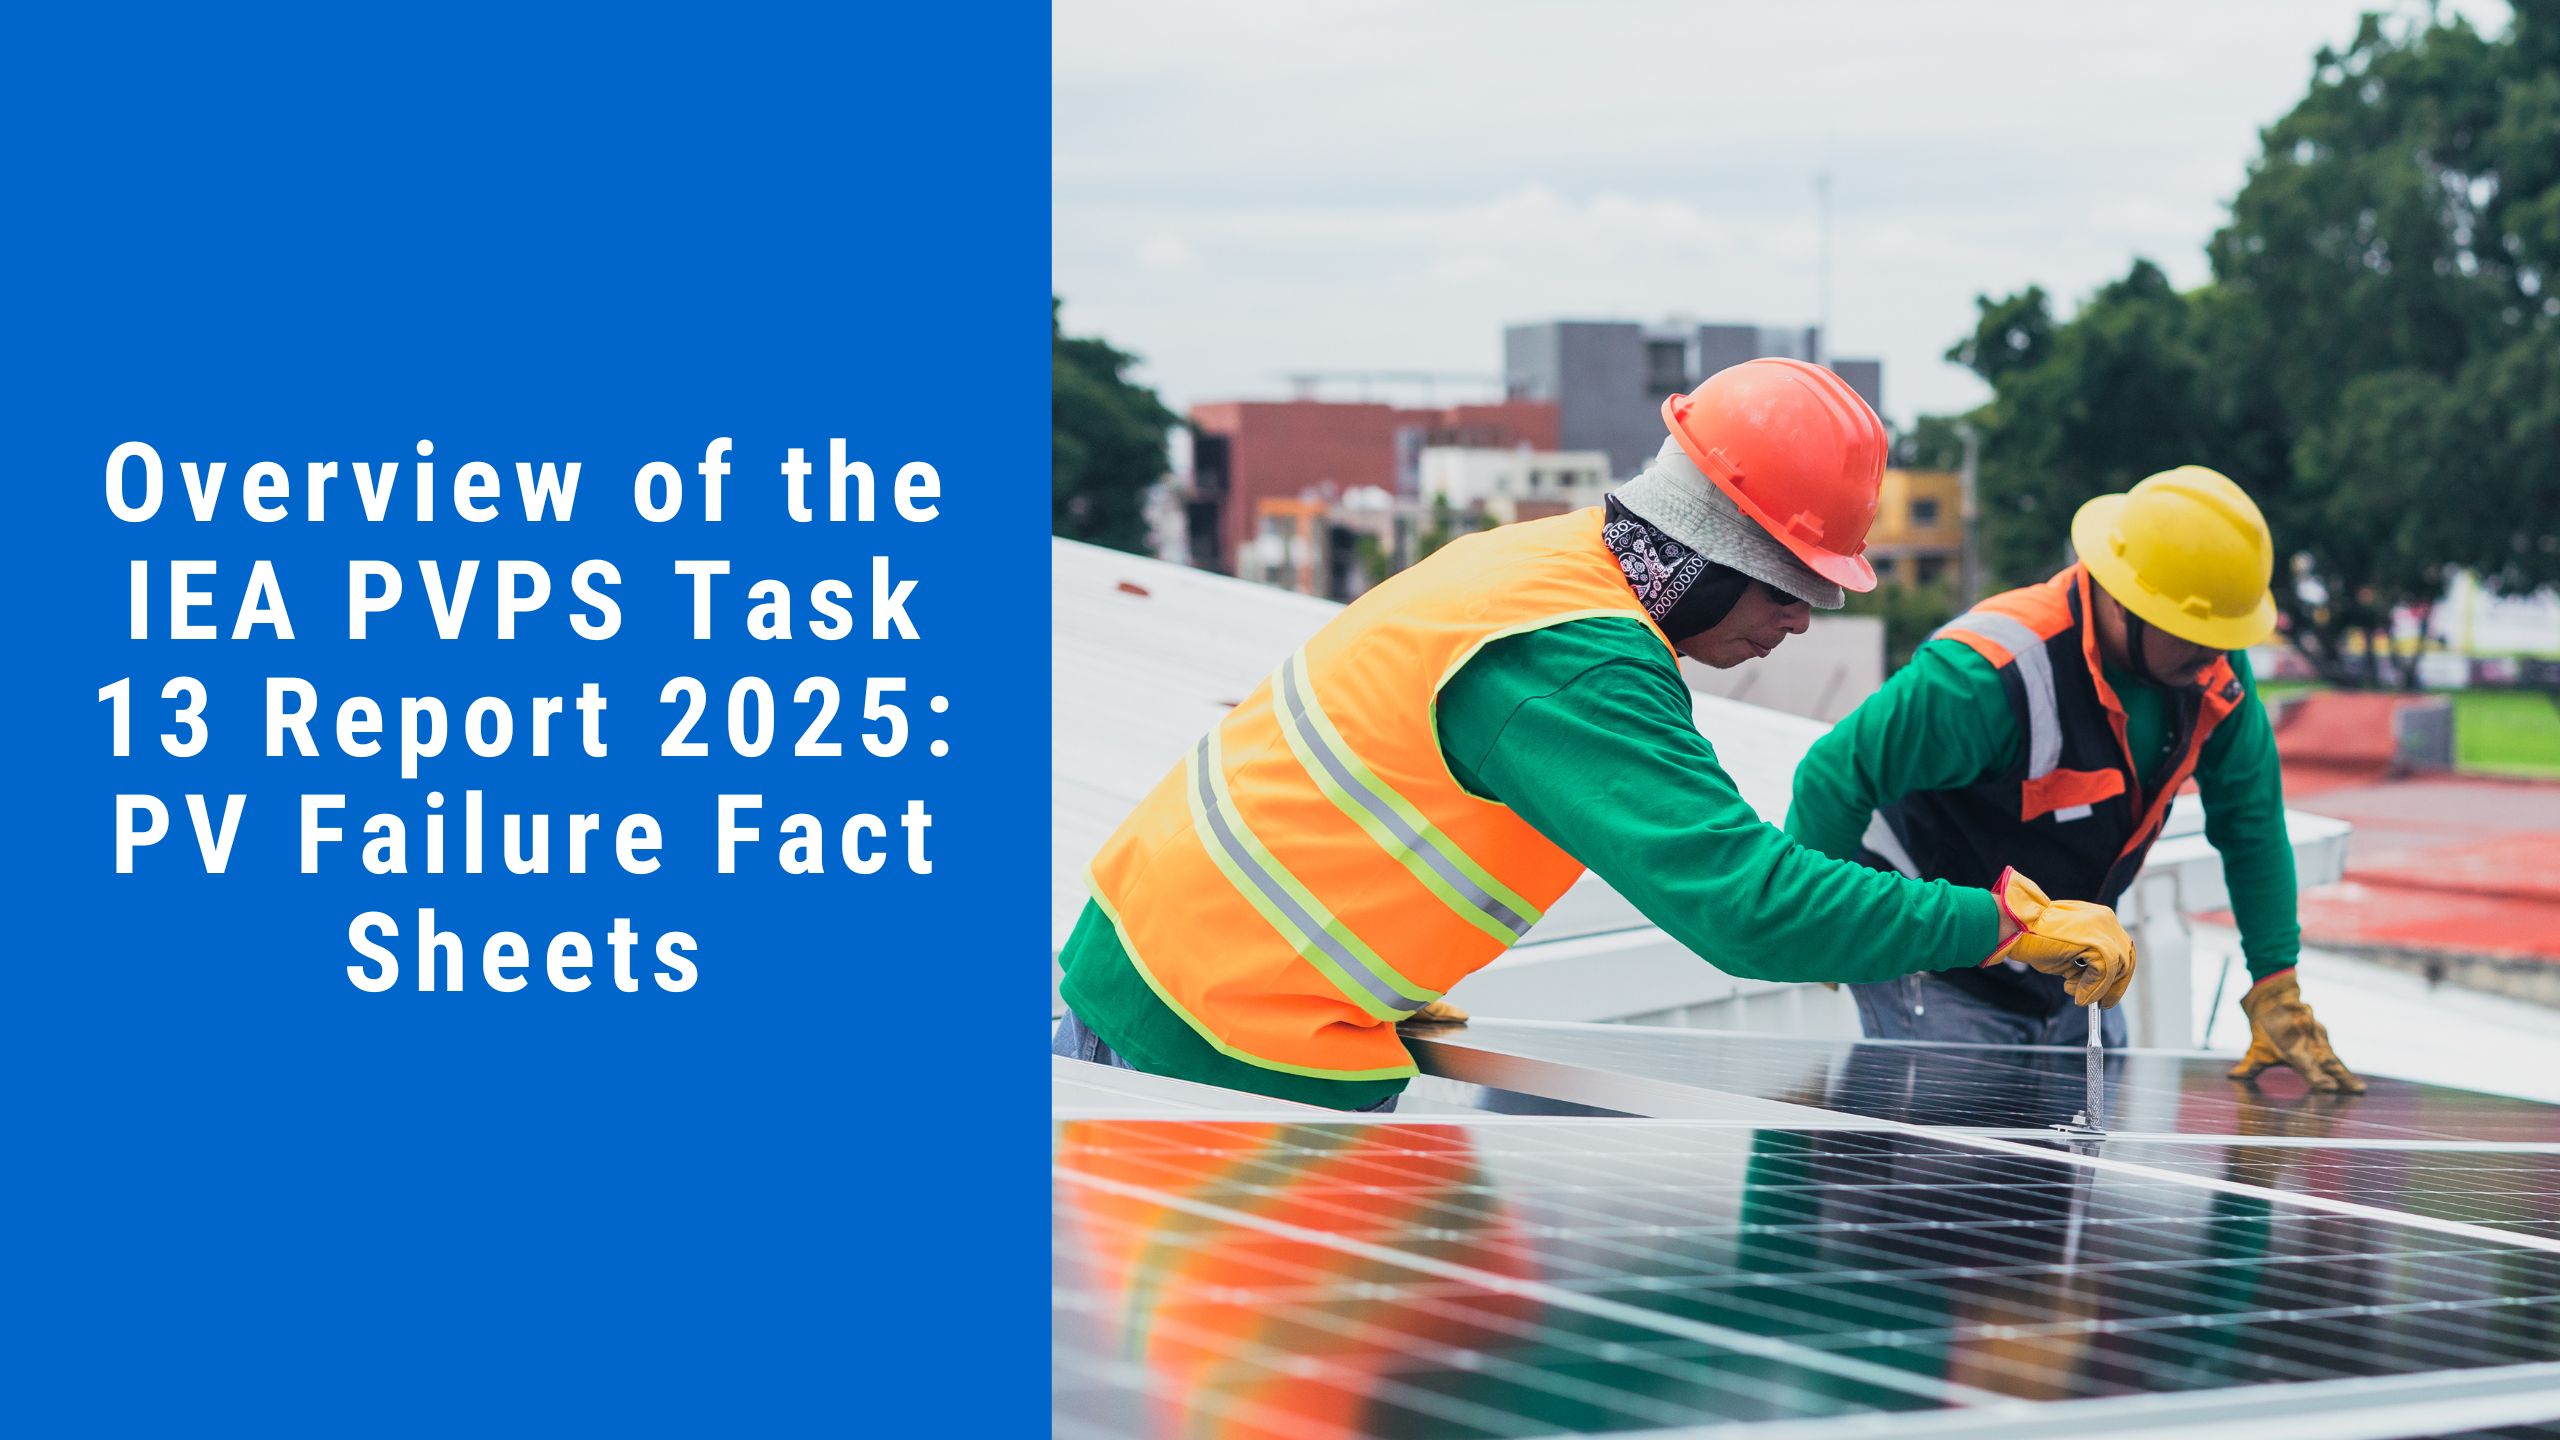
To help solar professionals stay ahead of these issues, the International Energy Agency (IEA) has released a powerful new report under its Photovoltaic Power Systems Programme (PVPS) – Task 13: “PV Failure Fact Sheets – 2025 Review”.
At Heaven Designs, we’re excited to share this expert-level knowledge with you because we know that the success of every solar project depends not just on installation but also on long-term reliability.
What is the IEA PVPS Task 13 Report?
The IEA PVPS Task 13 is a collaborative project between global experts from over 25 countries. The objective?
To investigate, document, and share detailed insights on the most common failures in PV systems — including how and why they happen, their real-world impacts, and the best strategies to detect and mitigate them.
The 2025 report is a significant update, featuring real failure examples, high-resolution images, detection methods, safety classifications, and prevention guidelines — making it one of the most comprehensive technical resources available in the solar industry today.
What You’ll Find in This Report
Here is a brief taster of why this is a must-read for solar engineers, EPCs, O&M teams, asset managers, and even solar investors alike:
1. 30+ Detailed Failure Modes
The report contains fact sheets for the most common PV system failures, which include:
- Cell cracks
- EVA discoloration
- Delamination of front and backsheet
- Junction box issues
- Glass breakage
- Hot spots
- PID (Potential Induced Degradation)
Failures are described with concrete descriptions, data from the field, and even how they look.
2. Risk Ratings Based on Safety and Performance
Each failure is scored according to:
Safety Impact: Might it cause fire, electrical shock , or injury?
Performance Impact: Zero to negative decimation (up to >3%/year)
This categorization is vital in prioritizing maintenance and replacement decisions for fielded systems.
3. Detection Methods
Failures, not all of them, are visible to the naked eye. The report also covers:
- Electroluminescence imaging (EL)
- Infrared thermography (IR)
- Visual inspection
- IV curve tracing
Test insulation and bypass diodes
These tools are very important to both the commissioning in addition to the periodic inspection of the systems.
4. CAPA (Corrective and Preventive Actions)
Each “failure sheet” contains short-term corrective actions and longer-term preventive actions, such as:
- Selection of relevant material in designing
- Guidelines for the handling and transport
- Installation best practices
- Monitoring recommendations
- Maintenance schedules
This information is immensely useful for project developers and O&M service providers who want to optimize performance over the long term.
What This Means for the Solar Industry
This report contributes decades of cumulative international experience — not just from lab tests but from field data from PV systems in the wild: dry deserts, wet tropics, snowy rooftops, etc.
Using these shared experiences as lessons learned can help stakeholders across the solar value chain to:
- Increase system uptime
- Enhance module and inverter longevity
- Makes solar investment have the maximum ROI
- Improve safety standards


