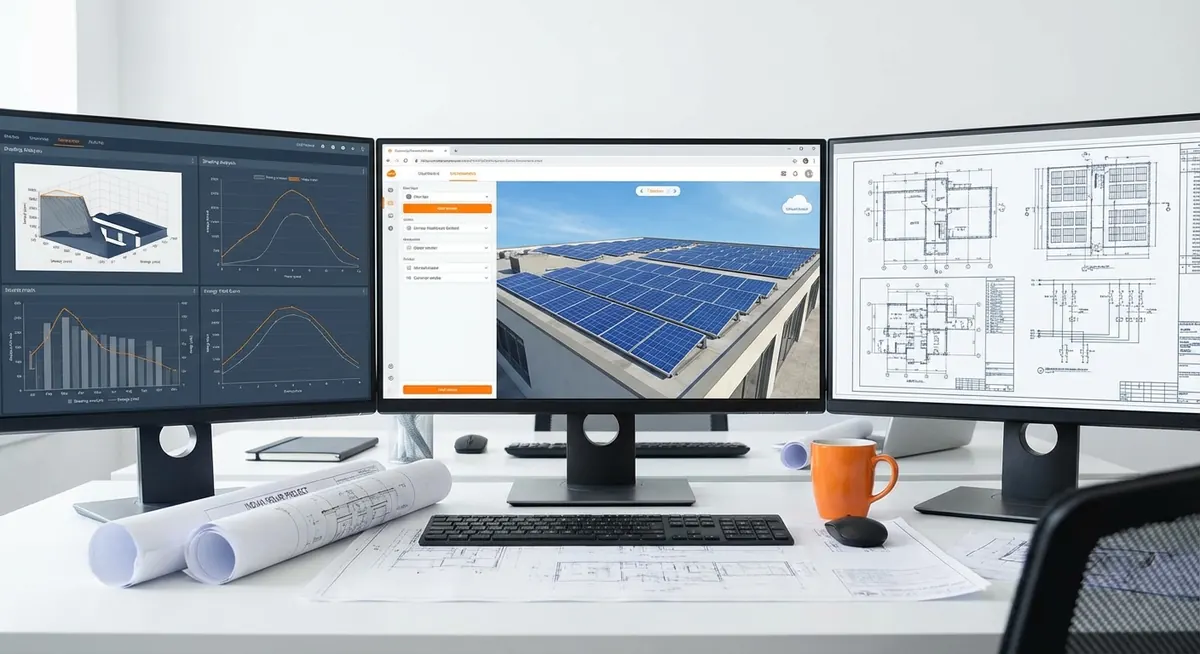
HOMER Pro is the simulation and optimisation tool used in over 95% of DFI-financed off-grid and hybrid solar feasibility studies in sub-Saharan Africa. When African Development Bank or IFC technical reviewers open a feasibility study, they expect to see HOMER Pro outputs — specifically the sensitivity analysis table, the dispatch results, and the NPC/COE comparison across system configurations. A HOMER model built incorrectly will produce results that look plausible in the report but fail lender scrutiny when the technical advisor runs a second simulation.
Direct answer. A bankable HOMER Pro model for an African hybrid or mini-grid project requires six correctly configured inputs: (1) an 8,760-hour load profile with temperature correction, (2) a site-specific TMY irradiance file from Solargis or Meteonorm, (3) PV module derating factor that includes soiling loss by season, (4) battery technology with correct round-trip efficiency and DoD limits, (5) generator fuel curve with minimum load ratio, and (6) a sensitivity sweep across PV capacity and battery capacity that identifies the minimum-NPC system meeting the DFI’s renewable fraction and unmet load thresholds.
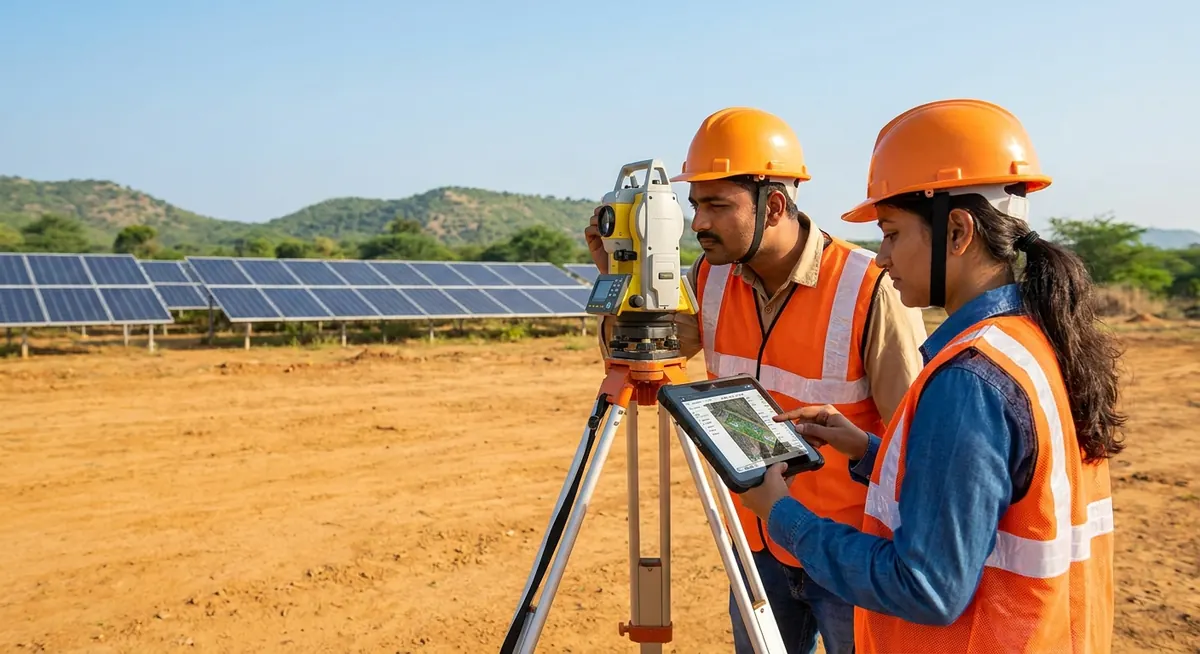
This walkthrough is for African EPC engineers and project developers who need to build a HOMER Pro model themselves — or who need to review a HOMER model submitted by a contractor. Every step names the HOMER Pro interface element where that input lives.
Why HOMER Pro is the Standard — Not an Optional Tool
Some engineers attempt mini-grid feasibility using spreadsheet sizing tools or vendor-provided calculators. These approaches fail DFI technical due diligence for two reasons. First, they cannot perform the dispatch simulation that determines generator run-hours, battery cycling, and real renewable fraction — they estimate these from rules of thumb. Second, they produce no sensitivity analysis, which DFI reviewers specifically look for as evidence that the sizing is robust to uncertainty.
Definition. HOMER Pro performs hourly dispatch simulation across 8,760 hours of a year, matching supply from PV, battery, and generator to the load at each hour. It then calculates the net present cost (NPC) of the system over the project life, incorporating equipment costs, fuel costs, O&M costs, and replacement costs discounted at the project's WACC.
HOMER Pro’s official documentation covers the full interface, but the documentation does not explain the African-specific parameter choices that distinguish a DFI-bankable model from a generic one. This walkthrough fills that gap.
| HOMER Pro feature | Use in African projects | DFI relevance |
|---|---|---|
| Hourly load profile import | Import measured or modelled community demand | Accurate revenue forecast |
| TMY solar data import | Import Solargis .csv or Meteonorm file | Site-specific yield |
| PV derating factor | Apply soiling and temperature correction | Conservative bankable yield |
| Battery dispatch strategy | Load-following vs. cycle-charging | Matches battery technology |
| Generator dispatch | Minimum load ratio, fuel curve | Accurate O&M cost and fuel savings |
| Sensitivity sweep | Range of PV and battery sizes | NPC-optimal system identification |
| HOMER Economics | NPC, COE, IRR, simple payback | DFI financial metrics |
| Emissions report | CO₂ savings vs. diesel baseline | DFI environmental requirement |
Step 1 — Setting Up the Project File
Open HOMER Pro and create a new project. Set the project location by entering the site coordinates (latitude and longitude from Google Earth or the Solargis site assessment). HOMER will load an approximate solar resource from its embedded NASA POWER data — do not use this as the final irradiance input. It is useful only for confirming that the latitude is correct.
Project settings to configure immediately:
- Currency: Use USD for all DFI projects, even if project costs are partially in local currency.
- Project lifetime: Set to 20 years for AfDB/IFC standard financing term.
- Discount rate: Enter the project WACC, not the default 8%. For a typical sub-Saharan Africa mini-grid: 10–14% (see country risk premium tables from the World Bank or IMF country reports).
- Inflation rate: Use the IMF’s 5-year forward inflation forecast for the host country.
- Capacity shortage penalty: Set to USD 1.00/kWh for telecom applications (reflecting diesel generation cost) or USD 0.50/kWh for community mini-grids (reflecting candle and battery alternative cost).
Step 2 — Building the Load Profile
The load profile is the most consequential input in the HOMER model. For community mini-grids, import the 8,760-hour load profile as a .csv file. The file must have one row per hour (8,760 rows) with the community load in kW for that hour.
If you do not have measured data, build the synthetic profile:
- From the demand assessment, determine the peak daily load (kW) and daily energy consumption (kWh/day) for the design year (Year 1).
- Build a typical weekday load shape (hourly distribution) and a weekend/holiday shape. The HOMER Pro load input accepts a 24-hour diurnal profile separately for weekdays and weekends.
- Apply seasonal variation: communities in most of sub-Saharan Africa have 10–20% higher load in the dry season (December–March) due to water pumping and extended evening lighting hours.
- Apply an annual growth rate: 5%/year for Years 1–5 (appliance acquisition phase), 3%/year for Years 6–20 (mature electrification). Enter this in HOMER’s Load → Growth Rate field.
Field tip. When importing a load .csv file into HOMER Pro, check the "Allow random variability" checkbox and set the variability to 5–10%. This adds statistical noise to the load profile, which produces more conservative (and more realistic) results for the battery cycling and generator run-hour calculations.
Step 3 — Importing the Solar Resource
In HOMER Pro, navigate to Resources → Solar → Add Solar Resource. Do not use the auto-populated NASA POWER data for DFI submissions. Instead, import the Solargis or Meteonorm TMY file.
Solargis import procedure:
- Purchase the Solargis GeoModel Solar Data service for the site coordinates. Request the TMY file in HOMER Pro format (.csv with 8,760 hourly GHI, DNI, and DHI values).
- In HOMER Pro: Solar Resource → Import → select the Solargis .csv file.
- HOMER will display the monthly GHI profile. Cross-check the annual average GHI against the Solargis site report to confirm import was successful.
Meteonorm import procedure:
- In Meteonorm 8, enter the site coordinates and generate a TMY. Export to HOMER Pro format.
- Import into HOMER Pro using the same Solar Resource → Import path.
After import, verify the monthly GHI profile makes meteorological sense for the site location. A site in northern Nigeria should show peak GHI in March–May (pre-monsoon) and a trough in July–August (monsoon cloud cover). If the imported profile shows peak GHI in July, the import has failed or the coordinates are wrong.
The HOMER-Africa Derating Protocol — A Proprietary Calibration Method
The HOMER-Africa Derating Protocol (HADP) is the calibration framework Heaven Designs uses to ensure that HOMER Pro PV output predictions are conservative enough for DFI bankability while not being so conservative that they force unnecessary system oversizing.
The HADP applies five sequential derating factors to the HOMER PV array output:
Temperature Derate
In HOMER PV settings, enter the temperature coefficient for power (Pmax) from the module datasheet — typically -0.30 to -0.40%/°C for standard PERC, -0.25 to -0.32%/°C for TOPCon. Select "Operating temperature" model and set the NOCT from the module datasheet. For Sahel sites, use an ambient temperature correction of +5°C above the TMY average for the hottest month to account for elevated module temperature.
Soiling Derate
Apply a monthly soiling reduction using HOMER's PV "Dirt/Soiling" factor. Set the dry-season months (November–March for most of West Africa) to 10–14% soiling reduction and the wet-season months to 2–4%. Enter these as month-by-month values in the PV configuration panel.
Wiring and Mismatch Derate
In HOMER's PV efficiency settings, enter a combined wiring + mismatch derate of 3–4%. This accounts for DC wiring resistance losses and module-to-module mismatch in field-installed arrays that do not receive flash testing.
Annual Degradation
Enter 0.5%/year degradation for PERC modules or 0.4%/year for TOPCon in HOMER's PV degradation field. This applies a compounding reduction to PV output over the 20-year project life, producing conservative Year 20 energy production that prevents the financial model from overstating long-term revenue.
Inverter Efficiency Correction
In the converter/inverter specification within HOMER, enter the weighted average efficiency from the European Efficiency (η_EU) calculation rather than the peak efficiency. For a hybrid inverter/charger operating in partial-load conditions typical of remote sites, η_EU is typically 92–95%, not the 97–98% peak efficiency stated on the datasheet.
The combined HADP derating factor for a typical Sahel site is 0.74–0.82, meaning the actual PV output will be 74–82% of the nameplate STC output. This conservative factor is what separates a field-validated HOMER model from an optimistic desktop estimate.
Step 4 — Configuring the Battery
In HOMER Pro, add the battery by navigating to Components → Battery → Add Battery. Two paths:
Path A — Use a HOMER battery model from the library: HOMER’s library includes VRLA and lithium-ion battery models. For LiFePO4, the “Generic 1 kWh Lead Acid” model is NOT appropriate — use a lithium model from the library or create a custom model.
Path B — Create a custom battery model: Required for specific battery products. Enter:
- Nominal voltage (V)
- Maximum capacity (kWh at C10 discharge rate)
- Minimum state of charge (SOC) — set 20% for LiFePO4, 40% for VRLA
- Charging efficiency (typically 98% for LiFePO4, 90% for VRLA)
- Discharging efficiency (typically 98% for LiFePO4, 90% for VRLA)
- Round-trip efficiency = charging × discharging (LiFePO4: 96%, VRLA: 81%)
- Lifetime throughput (kWh) — from manufacturer’s cycle life data
- Capital cost (USD/kWh)
- Replacement cost (USD/kWh) — typically 85–90% of capital cost for Year 10 replacement
96%
LiFePO4 round-trip efficiency
Standard HOMER Pro input
81%
VRLA round-trip efficiency
Standard HOMER Pro input
20%
Minimum SOC — LiFePO4
DFI standard battery spec
40%
Minimum SOC — VRLA
Cycle life preservation
Step 5 — Generator Configuration
Add the backup generator under Components → Generator → Add Generator. Key inputs:
- Minimum load ratio: Set 30–40% of rated capacity. A generator running below 30% of rated power “wet stacks” — unburned fuel deposits carbon in the exhaust system, reducing engine life. This is a critical parameter that many modelers ignore.
- Fuel curve: Enter the fuel consumption at 25%, 50%, 75%, and 100% of rated load from the generator data sheet. HOMER interpolates between these points.
- Fuel price: Use the current delivered diesel price at the site, not the pump price. Remote sites typically pay 15–40% above pump price for delivered diesel.
- Scheduled maintenance cost: Enter the annual service cost per hour of operation (typically USD 0.05–0.10/hour for a small generator).
- Capital cost: Enter the installed cost of the generator, including the automatic transfer switch (ATS) and fuel tank.
Watch out. HOMER Pro's default generator dispatch is "load following" — the generator only supplies what the load and battery deficit require. For VRLA batteries, "cycle charging" is the correct dispatch because VRLA batteries perform better when charged from a low SOC to a high SOC in a single cycle rather than in multiple partial cycles. Setting load-following dispatch for a VRLA system will dramatically reduce battery life in the real installation.
Step 6 — Running the Sensitivity Sweep
The sensitivity sweep is the most valuable and most frequently misconfigured feature in HOMER Pro. Navigate to Sensitivity → Add Sensitivity Variable.
For a bankable African hybrid project, run sensitivities on:
- PV capacity: Range from 50% to 200% of the initial design capacity, in increments of 10–20%.
- Battery capacity: Range from 50% to 200% of the initial design capacity.
- Diesel price: Range from 80% to 150% of current price (to test fuel price risk).
- Annual load growth: Range from 2% to 8% (to test demand uncertainty).
The sensitivity sweep will produce a results table with thousands of system configurations. Filter the results to show only configurations that meet:
- Unmet load fraction ≤ 1%
- Renewable fraction ≥ 70% (or 60% for AfDB eligibility)
- Generator minimum load ratio constraint satisfied
The minimum-NPC configuration in the filtered table is the recommended system. The DFI technical reviewer will expect to see the full sensitivity table as an appendix to the feasibility report, with the recommended system highlighted.
| System size | NPC (USD) | COE (USD/kWh) | RF (%) | Gen hrs/yr | Unmet (%) |
|---|---|---|---|---|---|
| 20 kWp + 80 kWh | 185,000 | 0.38 | 58 | 2,800 | 2.1% — fails |
| 30 kWp + 100 kWh | 210,000 | 0.43 | 71 | 1,900 | 0.6% ✓ |
| 40 kWp + 150 kWh | 245,000 | 0.50 | 82 | 1,200 | 0.2% ✓ |
| 50 kWp + 200 kWh | 285,000 | 0.58 | 89 | 700 | 0.1% ✓ |
The 30 kWp / 100 kWh configuration is the NPC-optimal DFI-bankable system for this example community.
Step 7 — Extracting Bankable Outputs
After the simulation runs, extract these specific outputs for the DFI technical package:
From the Simulation Results tab:
- Annual electricity production by source (kWh/year): PV, battery, generator
- Annual fuel consumption (litres/year)
- Renewable fraction (%)
- Annual CO₂ emissions (tonnes/year) — compare to diesel-only baseline
- Capacity shortage (kWh/year) — must be ≤ 1% of load
From the Cash Flow tab:
- NPC breakdown by component
- Annualised cost
- COE (USD/kWh)
- Simple payback period
From the Battery tab:
- Expected battery life (years)
- Annual battery throughput (kWh)
- Battery replacement schedule
From the Generator tab:
- Annual operating hours
- Annual fuel consumption (litres/year)
- Annual O&M cost
These outputs become Section 4 of the feasibility report (Technical Analysis) and Section 5 (Financial Model Inputs). For the complete feasibility methodology, see our guide on solar mini-grid feasibility in sub-Saharan Africa.
Need a HOMER Pro simulation for your African hybrid project?
Heaven Designs delivers DFI-bankable HOMER Pro simulation reports with the HOMER-Africa Derating Protocol applied — ready for AfDB, IFC, or USAID Power Africa technical review.
Download a sample HOMER report →Common HOMER Modeling Mistakes for African Projects
WHAT TO DO
- Use Solargis or Meteonorm TMY data for the exact site
- Apply monthly soiling derates (not a single annual average)
- Set minimum SOC to 20% (LiFePO4) or 40% (VRLA)
- Use the project WACC as the discount rate, not 8%
- Run sensitivity sweeps on PV, battery, fuel price, and load growth
WHAT NOT TO DO
- Use NASA POWER data for the final DFI submission
- Apply a flat 3% annual soiling loss (Europe figure, not Africa)
- Use VRLA round-trip efficiency (81%) for a LiFePO4 battery
- Set generator minimum load to 0% (enables wet stacking)
- Use a single NPC point without sensitivity analysis
How Heaven Designs Helps with HOMER Pro for African Projects
African EPC teams running DFI projects need HOMER Pro modelling that meets lender standards on the first submission. Heaven Designs provides:
- Site Survey & Land Feasibility Services — Solargis data procurement, soiling factor selection by region, load audit methodology.
- MW-Scale Project Management Consultancy — Owner’s engineer services that include HOMER model review, DFI technical reviewer coordination, and bankable documentation preparation.
- Solar Ground Mount Design — Structural design for the PV arrays modelled in HOMER, including wind load analysis and foundation engineering for sub-Saharan soil conditions.
- Download a sample deliverable — Download a redacted HOMER Pro simulation report showing the full sensitivity analysis table and dispatch results from a completed African hybrid project.
For the companion methodology on hybrid telecom tower design, see hybrid solar for African telecom towers. For the full mini-grid feasibility framework, see solar mini-grid feasibility in sub-Saharan Africa. Contact us to commission a HOMER Pro simulation for your project.
According to IRENA’s 2023 Renewable Power Generation Costs report, hybrid solar-battery-diesel systems achieve the lowest LCOE for remote loads between 5 kW and 5 MW in Africa — but only when correctly modelled and sized. A misconfigured HOMER model costs the same to produce as a correctly configured one and delivers a system that either over-spends on unnecessary capacity or fails to meet the renewable fraction threshold.
FAQ
Do I need HOMER Pro or can I use HOMER Grid for African mini-grid projects?
HOMER Grid does not support off-grid or isolated mini-grid modelling with generator backup dispatch. You must use HOMER Pro for any project that relies on a generator and battery system without continuous grid connection. HOMER Pro costs approximately USD 1,800/year for an annual licence. For project developers running fewer than three projects per year, commissioning a HOMER simulation service from an engineering firm is more cost-effective than an annual licence.
How long does a HOMER Pro simulation take to run?
A single system configuration simulation runs in seconds. A sensitivity sweep across 10 PV sizes × 10 battery sizes × 3 fuel prices × 2 load growth rates = 600 combinations typically takes 2–5 minutes on a modern desktop computer. Sensitivity sweeps with more combinations (1,000+) may take 15–30 minutes. Always run the full sensitivity sweep — do not submit a DFI report based on a single-point simulation.
What is the correct battery autonomy target for a sub-Saharan Africa mini-grid?
The standard DFI bankability target is 2–3 days of battery autonomy at the daily design load. For a community consuming 200 kWh/day, this means 400–600 kWh of usable battery capacity (at 80% DoD for LiFePO4). However, the HOMER sensitivity sweep often identifies a smaller battery (1.5 days of autonomy) as the NPC-optimal configuration because the generator can supply the gap on low-irradiance days at a lower NPC than additional battery capacity. Always use the HOMER result, not the autonomy rule of thumb, for the final system specification.
How do I account for future grid extension in the HOMER model?
If there is a credible probability that the national grid will reach the community within the project life (say 10 years), model a “grid connection event” in HOMER’s advanced settings. Set the grid connection cost and date of connection, and HOMER will calculate the NPC of the mini-grid system including the option value of transitioning to a grid-connected system at that point. This scenario analysis is increasingly required by DFI reviewers for projects in areas where national grid expansion is planned.
What renewable fraction threshold does IFC require for off-grid hybrid project financing?
IFC does not publish a single mandatory renewable fraction threshold — it reviews projects on a case-by-case basis. However, the IFC climate finance eligibility criteria for its off-grid energy portfolio uses 60% as the minimum renewable fraction for Climate Finance classification. Projects below 60% renewable fraction may still receive IFC financing but will not count toward IFC’s climate finance targets. AfDB’s SEFA programme uses 60% as a hard minimum for co-financing eligibility.
Can HOMER Pro handle a project with two different battery technologies — say VRLA for the first 5 years and LiFePO4 replacement at Year 5?
HOMER Pro does not natively model a mid-project battery technology switch. The standard approach is to model the project with VRLA for the full 20 years (conservative scenario) and then provide a separate sensitivity scenario with LiFePO4 replacement at Year 5 as a manual calculation in the financial model. DFI reviewers accept this dual-scenario approach. Show the NPC of both paths and recommend the lower-NPC option in the project recommendation.
What is a reasonable CAPEX estimate for a 100 kWp mini-grid in West Africa in 2026?
A 100 kWp / 400 kWh LiFePO4 mini-grid with a 30 kVA backup generator, distribution network for 300 connections, and smart prepaid metering typically costs USD 250,000–380,000 installed in West Africa in 2026, including civil works, import duties, and commissioning. The wide range reflects variation in local import duty rates (10–35% on modules and batteries), site access conditions, and distribution network length. IRENA’s 2023 benchmarks for sub-Saharan Africa mini-grids show installed costs of USD 2,000–3,500 per kWp for systems in this size range.