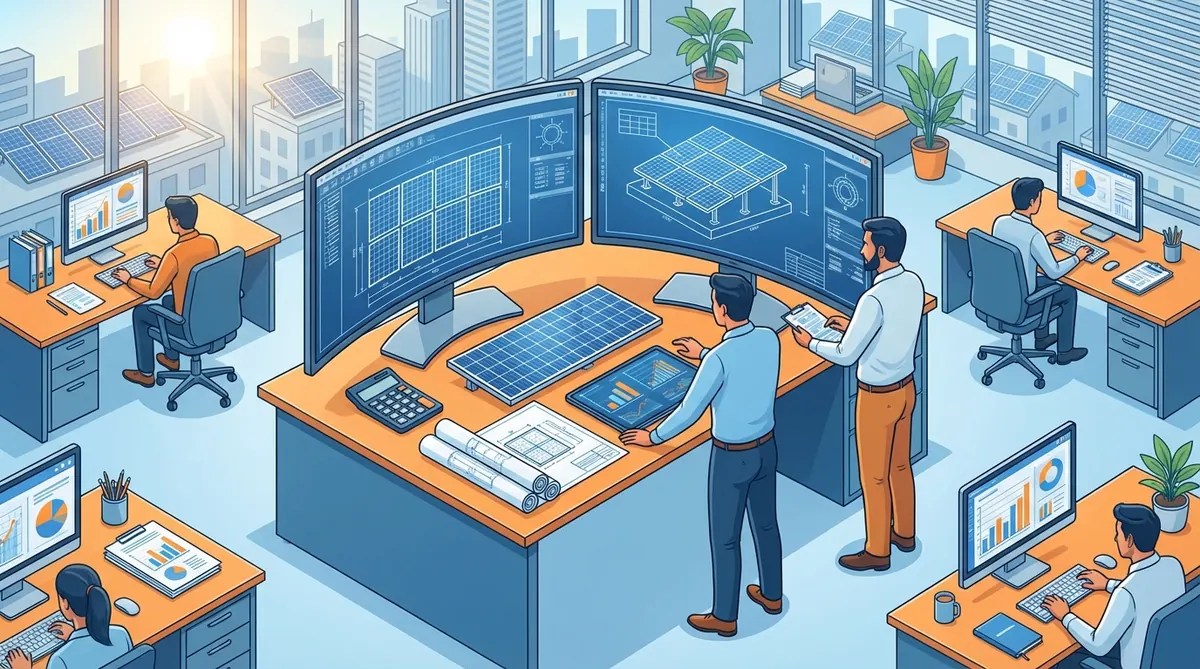
Engineering cost is the line item most EPC founders underestimate until year three, when a 5-MW rooftop pipeline suddenly reveals that their in-house design team costs more per MW than the structural steel on the same project. The per-MW solar engineering cost stack in 2026 is not a fixed number — it shifts with EPC size, project type, software licensing, and whether the firm runs its own PE bench or outsources to a specialist. This article builds the full cost stack from first principles, using real data from 300+ Indian EPC engagements.
Direct answer. Per-MW solar engineering costs in India range from ₹1.8 lakhs/MW for large EPCs with 50+ MW/year throughput to ₹6.5 lakhs/MW for sub-10 MW/year firms running in-house designers. The five cost drivers — salaries, software licenses, revision cycles, compliance documentation, and bench idle time — account for 94% of the variance. The Heaven Designs Per-MW Cost Stack Framework isolates each driver and shows where outsourcing cuts total engineering cost by 30–40%.
This breakdown serves EPC founders scaling past their first in-house designer and utility developers who need to tighten bid margins before a SECI auction. The numbers are India-specific; currency is ₹ throughout.
Why Per-MW Engineering Cost Varies 3.6x Across EPC Sizes
The 3.6x spread between a large EPC and a small one is not explained by salary differences alone. A senior solar designer in Surat earns roughly ₹55,000–₹75,000/month. That same designer, sitting idle between projects or stuck on revisions from a DISCOM that keeps changing format requirements, costs the firm far more per MW than the payslip suggests.
₹1.8L/MW
Large EPC (50+ MW/yr)
Heaven Designs client data, 2025
₹3.4L/MW
Mid EPC (15–50 MW/yr)
Heaven Designs client data, 2025
₹6.5L/MW
Small EPC (<10 MW/yr)
Heaven Designs client data, 2025
40%
Cost from idle bench time
Heaven Designs internal audit, 2025
The five structural cost drivers are salary load, software licenses, revision cycles, compliance documentation overhead, and bench idle time. Each deserves its own line in the cost model.
According to Mercom India’s 2025 India Solar Market Update, India added 24.5 GW of solar capacity in 2025 — meaning the absolute volume of engineering work has never been higher, and the margin pressure on per-MW cost has never been tighter.
The Five-Driver Engineering Cost Stack (Line by Line)
The Heaven Designs Per-MW Engineering Cost Audit breaks total engineering spend into five buckets. Every EPC can fill this in for their last 12 months and immediately see where the money goes.
Driver 1 — Salary load. A solar designer in Gujarat earns ₹55,000–₹75,000/month all-in (salary + PF + ESI + gratuity accrual). At 220 productive hours/month and an average of 45 MW-equivalent design-hours per MW on a C&I rooftop, one designer handles roughly 4–5 MW/month. That gives a salary-only cost of ₹11,000–₹18,750/MW — before any overhead.
Driver 2 — Software licensing. PVsyst costs approximately ₹80,000–₹1,10,000/year per license. AutoCAD LT runs ₹60,000–₹80,000/year. STAAD Pro (for structural) adds ₹1,20,000–₹1,80,000/year. A three-designer team needs at least three licenses per tool. At 40 MW/year throughput, software alone adds ₹8,000–₹12,000/MW.
Driver 3 — Revision cycles. DISCOM revision rounds are the hidden cost nobody tracks. An average Indian rooftop project goes through 2.3 revision rounds per DISCOM net metering process. Each round costs 4–8 designer-hours. At ₹375/hour fully loaded, that is ₹3,000–₹6,000/MW in pure revision cost — before the project delay cost.
Driver 4 — Compliance documentation. CEIG drawings, electrical CEIG compliance packages, and CEA Connectivity Regulations 2019 documentation for utility projects add 6–10 hours per MW that most EPCs attribute to “project management” rather than engineering cost.
Driver 5 — Idle bench time. This is the largest hidden cost. A designer hired for a pipeline that shrinks by 30% in Q3 still draws a full salary. Across 300+ EPC clients, Heaven Designs found that in-house designers are productively utilized for an average of 62% of their paid hours. The remaining 38% is overhead that inflates effective per-MW cost by 60%.
Watch out. Most EPC cost-per-MW calculations divide annual salary by annual MW throughput. This understates true cost by 35–55% because it excludes software, revision hours, compliance documentation, and the utilization gap. Run the full five-driver stack before making a hire-vs-outsource decision.
The Per-MW Cost Stack Framework: Project Type Comparison
Engineering cost per MW is not uniform across project types. A C&I rooftop, a ground-mount utility project, and a floating solar installation each carry different design complexity and documentation requirements.
| Project Type | Avg Design Hours/MW | Fully Loaded Cost/MW (₹) | Revision Rounds | DISCOM/CEA Docs |
|---|---|---|---|---|
| C&I Rooftop (100–500 kW) | 40–55 hrs | ₹3.2–4.8L | 2–3 | DISCOM SLD, GA, net metering |
| Industrial Rooftop (500 kW–2 MW) | 35–50 hrs | ₹2.8–4.2L | 2–3 | DISCOM + CEIG |
| Ground Mount (1–10 MW) | 55–80 hrs | ₹3.8–5.5L | 1–2 | CEA Connectivity + CEIG |
| Utility Ground Mount (10 MW+) | 65–100 hrs | ₹2.2–3.5L | 1 | CEA + PGCIL + IE review |
| Floating Solar (1 MW+) | 80–120 hrs | ₹4.5–7.2L | 1–2 | CEA + structural + civil |
The utility ground-mount figure is lower per MW because of economies of scale — one layout covers more MW, and the documentation structure is more standardized than a fragmented C&I rooftop portfolio. Read the complete MW-scale design workflow for a full breakdown of what goes into a utility project package.
The Heaven Designs Per-MW Cost Audit Framework
This is the proprietary framework Heaven Designs uses when an EPC founder asks “should I hire a designer or outsource?” It runs in four steps and produces a defensible per-MW cost figure in under two hours.
Collect Last 12 Months' Data
Pull total engineering salary cost (CTC + PF + ESI), software license spend, and MW delivered. This is the denominator-and-numerator baseline.
Apply the Utilization Multiplier
Divide total salary by actual utilization rate (ask designers to log hours for two weeks). If utilization is 65%, multiply your cost-per-MW by 1.54 to get the true rate.
Add Revision and Compliance Overhead
Count revision rounds from the last 10 projects. Multiply average rounds by 5 hours by your hourly rate. Add compliance documentation hours separately — these rarely appear in project timesheets.
Compare Against Outsourced Rate
Get a per-project quote from a specialist engineering firm. Include revision rounds in the quote (most good firms include 2 rounds free). The gap between your true cost and the outsourced rate is the opportunity cost of the current model.
EPC Size vs. Outsourced Rate: When the Math Flips
The crossover point — where outsourcing costs the same as in-house engineering — is a function of MW throughput and project mix. The table below uses 2026 market rates for a mid-tier outsourcing partner with full DISCOM format coverage.
| Annual MW Throughput | In-House Cost/MW | Outsourced Cost/MW | In-House Advantage |
|---|---|---|---|
| Less than 5 MW/yr | ₹6.5L | ₹3.0L | None — outsource |
| 5–15 MW/yr | ₹4.8L | ₹2.8L | None — outsource |
| 15–30 MW/yr | ₹3.4L | ₹2.5L | Marginal |
| 30–60 MW/yr | ₹2.6L | ₹2.2L | Slight in-house edge |
| 60+ MW/yr | ₹1.8L | ₹2.0L | In-house wins |
The crossover is typically around 35–45 MW/year for a well-run in-house team. Below that threshold, outsourcing consistently wins on cost. Read the in-house vs outsourcing India analysis for the full decision model.
Field tip. The crossover point drops by 10–15 MW/year if your project mix is heavy on C&I rooftop (more revision cycles, more DISCOM format variation) versus utility ground-mount (more standardized documentation). Calculate it separately for each project type.
Software License Cost: The Underpriced Line Item
Software is consistently the most underestimated cost in EPC engineering budgets. Most founders think of it as a one-time purchase rather than a per-MW overhead. Here is the 2026 license stack for a standard Indian solar EPC:
| Software | Annual License (₹) | Per-MW at 20 MW/yr | Per-MW at 50 MW/yr |
|---|---|---|---|
| PVsyst | ₹90,000 | ₹4,500 | ₹1,800 |
| AutoCAD LT | ₹70,000 | ₹3,500 | ₹1,400 |
| STAAD Pro | ₹1,50,000 | ₹7,500 | ₹3,000 |
| HelioScope | ₹1,20,000 | ₹6,000 | ₹2,400 |
| MS Office/Project | ₹30,000 | ₹1,500 | ₹600 |
| Total | ₹4,60,000 | ₹23,000/MW | ₹9,200/MW |
At 20 MW/year, software alone costs ₹23,000/MW — more than many EPCs budget for their entire design function. An outsourced engineering partner amortizes these licenses across dozens of clients, effectively bringing the per-MW software cost to near zero for the EPC.
According to Bridge to India’s India Solar Handbook 2025, software and digital tools now represent 18–22% of total solar engineering overhead for Indian EPCs, up from 12% in 2021 — driven by the shift to PVsyst-mandatory bankable reports and STAAD Pro structural certifications.
Revision Cost: The 2.3-Round Reality
Every EPC knows revisions happen. Few EPCs actually count them or assign a cost. The 2.3-round average across Indian C&I projects breaks down as follows:
Round 1 — DISCOM format correction. Most DISCOMs in India have their own SLD and GA format requirements that differ from IS 16221 defaults. A designer unfamiliar with the specific DISCOM rejects Round 1 drawings at a rate of 68% in new states, according to Heaven Designs’ DISCOM compliance data.
Round 2 — Structural revision. The client’s building structural drawings rarely match the load assumptions in the mounting design. A rework of purlin sizes or angle calculations takes 4–6 hours.
Round 3 (conditional) — Net meter application format. Several DISCOMs (MSEDCL, BESCOM, BSES) changed their net meter application formats in 2024–2025. Old templates generate a third round.
At ₹375/fully loaded designer-hour, three revision rounds on a 200 kW project cost ₹4,500–₹9,000 in direct labour — plus the project delay cost if DISCOM approval is on the critical path to commissioning.
See a real per-MW cost breakdown
Download Heaven Designs' sample engineering deliverable pack — includes SLD, GA, structural calc, BOQ, and DISCOM submission checklist for a real 300 kW rooftop project.
Get the sample pack →Compliance Documentation: The Invisible 20%
Engineering compliance in India is a three-layer stack: MNRE/state policy compliance, DISCOM format compliance, and structural/electrical safety compliance (IS 875, CEA Connectivity Regulations 2019, IS 16221). Most EPCs budget for the first layer and undercount the second and third.
A ground-mount solar project in India above 500 kW requires:
- CEA Connectivity Regulations 2019 documentation (single-line diagram, protection relay coordination, earthing design)
- CEIG approval drawings (state-specific format)
- Structural design report (IS 800 or IS 875 Part 3 wind zone)
- DISCOM interconnection application
- Performance bank guarantee documentation (engineering basis)
A team unfamiliar with CEA Connectivity Regulations 2019 requirements will spend 20–30 extra hours per project on compliance rework — a cost that never shows up in the design-hours column but absolutely appears in the per-MW cost.
According to the Central Electricity Authority’s Connectivity Regulations, grid-connected systems above 500 kW must submit protection coordination studies, earthing designs, and relay settings documentation — requirements that changed substantively in 2022 and again in 2024.
Pros and Cons: In-House vs. Outsourced Engineering Bench
IN-HOUSE PROS
- Full control over design priorities
- Institutional knowledge of client base
- Faster turnaround at peak throughput
- Easier to embed in site survey workflow
IN-HOUSE CONS
- Fixed cost regardless of pipeline volume
- High turnover risk (average tenure 18 months)
- Software license overhead
- Training burden as codes update
- Peak demand cannot be handled without overtime
Verdict. For EPCs below 35 MW/year, the cost case for outsourcing is unambiguous. The fixed-cost structure of an in-house bench means per-MW cost balloons during low-pipeline quarters. Above 60 MW/year with a stable project mix, a well-managed in-house team edges out outsourcing — but only if utilization stays above 80%. The hybrid model (core in-house designer + outsourced overflow) typically delivers the best per-MW economics for 20–60 MW/year EPCs.
How Heaven Designs Helps
When an EPC founder runs the Per-MW Cost Audit Framework and finds a gap of ₹1.5–₹3L/MW between their current cost and what outsourcing offers, the next question is how to close it without disrupting active projects. Heaven Designs operates as an on-demand engineering bench — capacity is variable, cost is per-deliverable, and every format is DISCOM-matched.
- Solar Rooftop Detailed Engineering Design — Full IFC pack including GA, SLD, structural calc, BOQ, and DISCOM submission format. Per-project pricing with two revision rounds included.
- Solar Ground Mount Design — Utility-scale layouts, CEA Connectivity documentation, STAAD Pro structural reports, and single-line diagrams for CEIG approval.
- Electrical CEIG Drawings — CEIG-approval-ready electrical drawings for all major Indian states, formatted for the relevant state DISCOM.
- STAAD Pro Structural Reports — Structural calculation reports for mounting systems, compliant with IS 800 and IS 875 Part 3.
- Download a sample deliverable — See the exact output quality before committing to a project engagement.
Contact Heaven Designs to run your own Per-MW Cost Audit and get a project quote within 24 hours.
FAQ
What is the average per-MW solar engineering cost in India in 2026?
Per-MW solar engineering cost in India ranges from ₹1.8 lakhs/MW for large EPCs executing 50+ MW/year to ₹6.5 lakhs/MW for small EPCs below 10 MW/year. The five cost drivers — salaries, software licenses, revision cycles, compliance documentation, and idle bench time — explain 94% of the variance. Most EPCs underestimate true cost by 35–55% because they exclude utilization gaps and compliance overhead from their calculations.
Which project type has the highest per-MW engineering cost in India?
Floating solar carries the highest per-MW engineering cost (₹4.5–₹7.2 lakhs/MW) because of the additional civil design, pontoon structural analysis, and underwater cable routing documentation. Standard C&I rooftop projects range from ₹3.2–₹4.8 lakhs/MW. Utility ground-mount above 10 MW benefits from economies of scale and typically runs ₹2.2–₹3.5 lakhs/MW when design is well-organized.
At what throughput does in-house solar design become cost-competitive with outsourcing?
The crossover point is approximately 35–45 MW/year for a well-managed in-house team with stable project mix and high designer utilization (above 80%). Below 35 MW/year, outsourcing consistently delivers lower per-MW cost because it eliminates idle bench time, software license overhead, and the training burden of keeping up with changing DISCOM formats and CEA regulations.
How much does DISCOM revision overhead add to per-MW engineering cost?
DISCOM revision rounds add ₹3,000–₹9,000/MW depending on the state and project type. The average Indian C&I project goes through 2.3 revision rounds. Each round consumes 4–8 designer-hours at a fully loaded cost of ₹375/hour. In high-rejection states like Maharashtra (MSEDCL) and Karnataka (BESCOM), projects with unfamiliar format specialists see 3–4 rounds, pushing revision cost above ₹12,000/MW.
Does software licensing significantly affect per-MW engineering cost?
Yes. A standard Indian EPC running PVsyst, AutoCAD, STAAD Pro, and HelioScope pays approximately ₹4.6 lakhs/year in software licenses for a three-designer team. At 20 MW/year throughput, this alone adds ₹23,000/MW to engineering cost. At 50 MW/year, it drops to ₹9,200/MW. An outsourced engineering partner amortizes these costs across dozens of clients, making the per-MW software contribution near zero for the EPC.
How does designer idle time inflate per-MW cost?
Designer idle time — hours paid but not productively utilized — inflates the effective per-MW cost by 38–62% depending on pipeline consistency. Heaven Designs’ audit of 300+ EPC clients found average utilization of 62%, meaning EPCs effectively pay for 1.6 designers for every 1 MW of output. The fix is either to hit the 35–45 MW/year threshold where utilization naturally rises, or to outsource and convert fixed cost into variable cost.
What is the typical cost of the solar engineering cost audit framework?
The Per-MW Engineering Cost Audit Framework described in this article can be run internally at no cost using last year’s payroll and project data. It takes 2–4 hours to complete. Heaven Designs offers a guided version as part of the solar engineering costs assessment process, which includes comparison against market rates and a project-specific outsourcing recommendation.
How does EPC size affect the decision to outsource engineering?
EPC size is the single largest determinant of the outsource decision. Small EPCs (less than 10 MW/year) face per-MW costs 3.6x higher than large EPCs primarily because of fixed-cost dilution. The outsource solar design guide covers the full decision framework including contract structure, quality checkpoints, and transition management for EPCs moving from in-house to outsourced engineering.